






We may receive a commission for purchases made through the links provided here. Learn More Learn More.
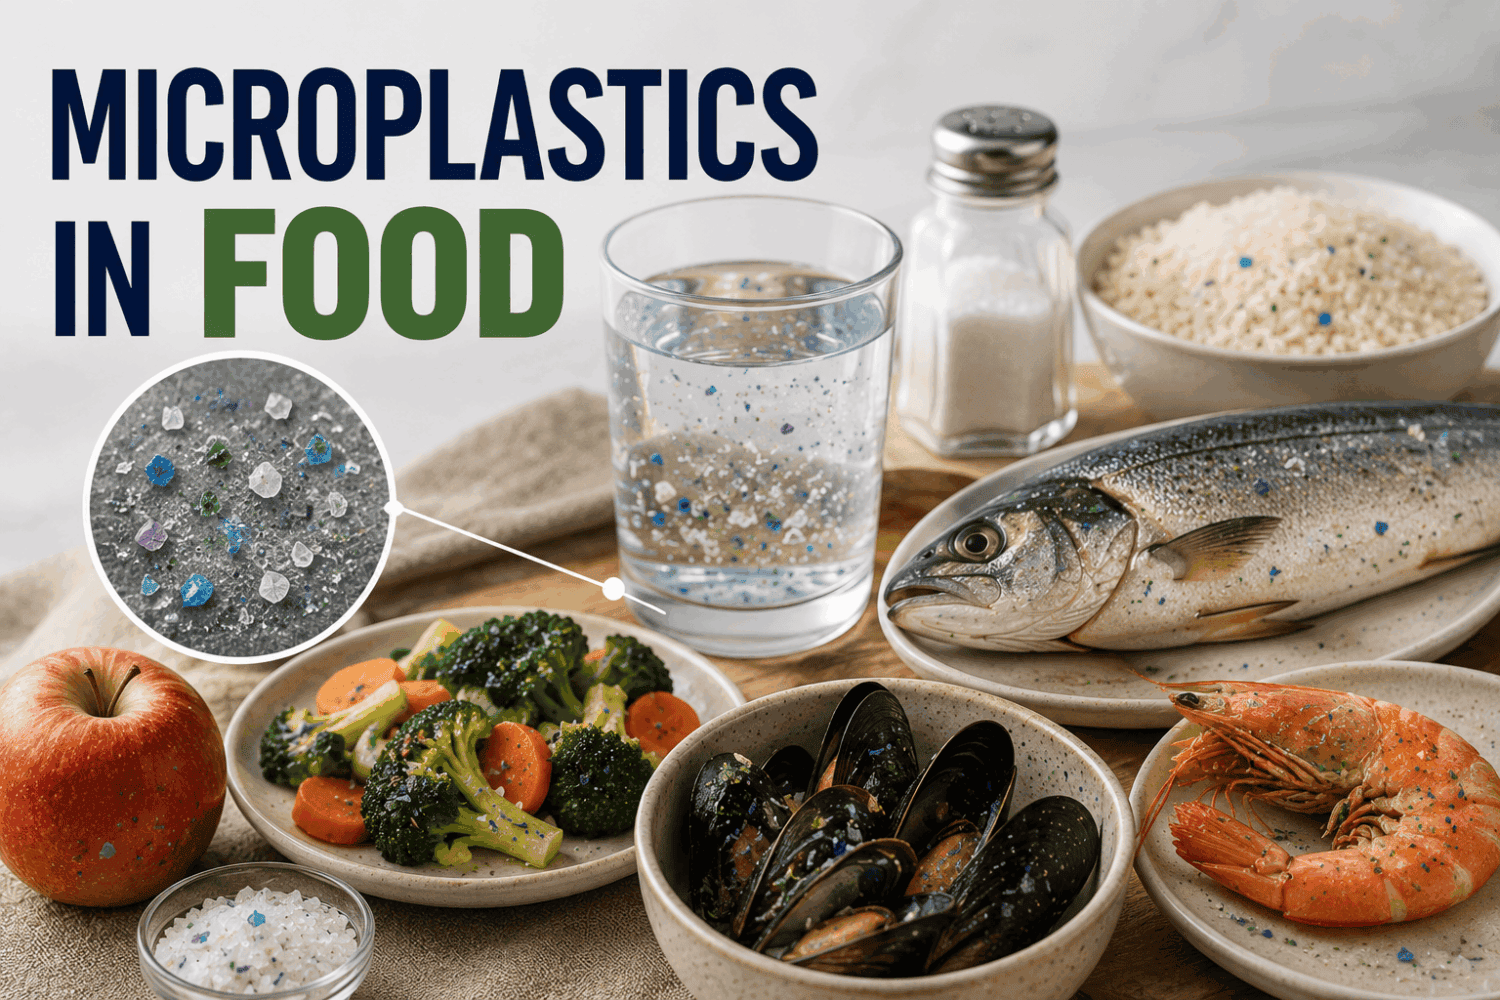
Microplastics in Food: The question most people reach for when they first encounter microplastics research is the quantitative one: not “are they there?”, the evidence for that is now overwhelming, but “how many?” And following immediately from that: “which foods are worst, and can I avoid them?”
The quantitative picture is both better and worse than most people expect. Better, in that some of the highest-contamination exposure routes (bottled water, specifically) are highly modifiable. Worse, in that essentially all food categories contain some measurable microplastic contamination, and the foods that contribute most by total particle count are staple items consumed multiple times daily.
This article covers the current quantitative estimates, which food categories contribute most and why, how detection methods affect the numbers, and what you can realistically change.
TL;DR
- Average adult ingests an estimated 39,000 to 52,000 microplastic particles per year from food alone; 74,000 to 121,000 when air inhalation is included
- Fruit, vegetables, and grains contribute the most particles by volume simply because they are eaten so frequently
- Bottled water is the highest single-serving concentration source and is highly modifiable by switching to filtered tap water
- Seafood and shellfish are high in concentration per serving but typically consumed less frequently
- Sea salt is surprisingly highly contaminated and easily swapped for rock salt
- Organic food is not meaningfully lower in microplastics than conventional equivalents
The Numbers: Current Best Estimates
Quantifying human microplastic ingestion is technically demanding and methodologically complex. Detection methods vary, different techniques detect different size ranges, different polymer types, and have different sensitivity thresholds. Studies examine different food categories. Geographic variation affects contamination levels. For all these reasons, estimates across studies span a wide range.
Evaluating approximately 15% of Americans’ caloric intake, researchers estimate annual microplastic consumption ranges from 39,000 to 52,000 particles depending on age and sex. These estimates increase to 74,000 to 121,000 when inhalation is considered alongside food intake.
On average, a person ingests approximately 5 grams of microplastics every week, roughly the equivalent weight of one credit card.
A 2026 study in the Journal of Hazardous Materials using updated detection methods and a broader range of food categories provided revised estimates: The total daily intake of microplastics was estimated to range between a few thousandths and hundreds of millions of particles per kilogram of body weight per day, with a median value of 721 particles per kilogram of body weight per day.
For a 70kg adult, 721 particles per kilogram per day works out to approximately 50,470 particles per day, consistent with the annual estimates above divided by 365 days.
These are order-of-magnitude estimates, not precise measurements. The true figure is likely higher because current detection methods have limited sensitivity to nanoplastics below 1 micrometer, the smallest and potentially most biologically active particles are systematically undercounted.
Which Foods Contribute the Most? The Frequency Effect
The most important insight from the food-category research is the dominance of frequency in determining which foods contribute most to total daily intake. A food that is moderately contaminated but eaten three times per day contributes far more total particles than a highly contaminated food eaten once per week.
Fruit, vegetables, and grains together account for roughly 99.5% of all microplastic particles consumed daily because they are eaten so frequently.
This is a profoundly important finding that defies intuitive expectations. Shellfish, which are individually among the most contaminated foods per serving, contribute a tiny fraction of total dietary microplastic exposure because most people eat shellfish only occasionally. Meanwhile, an apple, which has modest microplastic contamination per serving, contributes significantly to total exposure because it’s eaten daily.
The frequency effect means that strategies targeting high-frequency, moderately contaminated foods are more impactful for total exposure reduction than avoiding occasional high-contamination items.
Fruits and Vegetables
The microplastic contamination in produce comes primarily from:
- Irrigation with microplastic-contaminated water
- Atmospheric deposition onto growing surfaces
- Soil contamination from plastic mulch films and biosolid application
- Plastic packaging during transport and retail
The contamination is predominantly surface-based (external deposition and irrigation contact), which means thorough washing removes some of it, though not all. Produce with large surface area-to-volume ratios (leafy greens, berries) tends to show higher contamination per gram than dense produce (whole citrus, melons) because of greater surface exposure.
Practical implication: Washing produce thoroughly reduces surface-deposited contamination. Choosing produce grown with drip irrigation (lower contact with irrigation water) over overhead irrigation may slightly reduce contamination. These are modest improvements rather than transformative changes.
Bottled Water: The Highest Per-Serving Concentration
Individuals who meet their recommended water intake through only bottled sources may be ingesting an additional 90,000 microplastics annually compared to 4,000 microplastics for those who consume only tap water.
A 2021 study published in PNAS found that a single liter of bottled water contains an average of approximately 240,000 plastic particles. The primary contamination source is the PET bottle itself, particles are released from the container material through normal contact, temperature cycling (warming and cooling during transport and storage), carbonation (in sparkling water), and mechanical stress during opening and pouring.
This is the highest-concentration, most modifiable microplastic exposure source in most people’s daily lives. Switching from bottled to quality-filtered tap water eliminates this exposure almost entirely and is a cost-effective change (filtered water is dramatically cheaper than bottled over time).
Tap Water: Lower but Not Zero
Tap water contains microplastics from atmospheric deposition into water sources, pipe materials (particularly PVC pipes), and water treatment processes. Multiple studies have measured microplastic concentrations in tap water globally, finding variable but generally lower concentrations than bottled water.
The contamination is reduced (but not eliminated) by quality filtration. Reverse osmosis systems remove the vast majority of particles; high-quality activated carbon block filters remove most particles above their rated pore size.
Seafood and Shellfish: High Concentration Per Serving
Filter-feeding marine animals, mussels, oysters, clams, scallops, accumulate microplastics at high concentrations because they filter large volumes of seawater to extract nutrients, retaining particles in their soft tissues. A 2021 study found mussels contained approximately 7 microplastic particles per gram of tissue. A standard 200g serving of mussels (edible portion) contains approximately 1,400 particles.
Fish generally have lower concentrations than filter feeders, primarily because fish gut tissue (where most particles concentrate) is often removed before consumption. Wild-caught fish from cleaner waters have lower contamination than fish from heavily polluted areas.
Practical implication: Shellfish consumption contributes significant per-serving microplastic exposure. For frequent shellfish consumers, reducing frequency or choosing lower-contamination species may be meaningful. However, shellfish have significant nutritional value (omega-3 fatty acids, zinc, iodine) that must be considered in any dietary adjustment.
Salt: A Surprisingly High Contributor
Multiple studies have found measurable microplastic contamination in sea salt, with concentrations ranging from very low to over 1,600 particles per kilogram in some samples. The wide range reflects genuine geographic variation in sea salt contamination based on harvesting location.
Sea salt (harvested from coastal marine environments) has the highest measured contamination. The marine environment from which it is harvested is itself contaminated, and the evaporation and concentration process concentrates any particles present in the source water.
Himalayan pink salt and other rock salts (mined from ancient geological deposits formed long before plastic production) consistently show much lower microplastic contamination. The ancient deposit origin means these salts were never in contact with plastic-contaminated water.
Lake salt shows intermediate contamination, varying by the contamination level of the source lake.
The practical switch: Rock salt or Himalayan pink salt instead of sea salt is a genuinely easy, zero-cost substitution that meaningfully reduces this contamination source. Both are available at similar prices to sea salt. This is one of the highest effort-to-impact ratio changes available.
Processed and Packaged Foods
Ultra-processed foods in plastic packaging have multiple contamination routes:
- Extended contact between food and plastic packaging during storage
- Higher contamination in high-surface-area to volume packaging (thin bags vs rigid containers)
- Heat exposure during processing and transport
- Acidic or fatty food matrices that accelerate plastic leaching
Minimally processed alternatives (whole foods, foods with minimal plastic contact) have lower packaging-associated contamination.
Animal Products
Meat: Generally lower per-serving contamination than seafood. Microplastics in livestock are found primarily in the gut (typically removed before consumption) and at lower levels in muscle tissue.
Dairy: Some microplastic contamination has been detected in milk, possibly from atmospheric deposition and processing equipment. Not among the highest-priority sources.
Eggs: Low contamination detected in most studies.
Honey: Surprisingly high contamination in some studies, possibly from airborne particles and wax storage containers.
Detection Methods and Why Numbers Vary
A significant source of confusion about microplastic contamination levels is the variation in reported numbers across studies. Understanding why this variation exists helps interpret the estimates more accurately.
Detection method differences: Older studies used visual microscopy, which can only detect particles above approximately 50 to 100 micrometers. More recent studies using pyrolysis-gas chromatography-mass spectrometry (Py-GC-MS) or Raman spectroscopy detect much smaller particles, including microplastics down to 1 to 10 micrometers. Studies using newer, more sensitive methods report much higher particle counts from the same food items than older studies.
Size range analyzed: Some studies report only particles above 100 micrometers. Others report particles down to 1 micrometer. Studies reporting smaller size ranges consistently find higher total particle counts.
Polymer types detected: Different detection methods have different sensitivities to different polymer types. A study optimized for polyethylene detection may miss polypropylene or polystyrene particles.
Nanoplastics not yet routinely measured: Particles below 1 micrometer require specialized techniques (nanoparticle tracking analysis, electron microscopy, high-sensitivity spectroscopy) that are not yet routine in food analysis. All current estimates significantly undercount nanoplastic ingestion.
The practical implication: reported contamination levels are almost certainly underestimates of the true total particle burden, and estimates will continue to rise as detection methods improve. This is not cause for additional alarm about new sources, it reflects improving our ability to see what was already there.
What You Can Change: Ranked by Impact
Tier 1: Highest Impact, Highly Modifiable
Switch from bottled to filtered tap water. Eliminates the highest-concentration routine exposure source. Investment: water filter ($30 to $300+ depending on system). Returns: savings on bottled water that often exceed filter cost within months.
Stop heating food in plastic containers. Eliminates direct high-temperature particle-food transfer. Investment: glass or ceramic containers (often already owned). Cost: zero if you already have glass bowls or ceramic plates.
Switch sea salt to rock salt or Himalayan pink salt. High-impact substitution at zero additional cost and no quality trade-off.
Tier 2: Moderate Impact
Choose glass-packaged alternatives for high-frequency items (tomato sauce, condiments, beverages) when available at similar cost.
Wash produce thoroughly to remove surface-deposited particles. Particularly valuable for leafy greens and berries.
Reduce bottled beverage consumption broadly (not just water): bottled juices, soft drinks in plastic bottles, and other plastic-packaged beverages share the same plastic-leaching contamination mechanism as bottled water.
Tier 3: Supporting Strategy
Chitosan supplementation (Sifts Daily) supports gut-based elimination of particles that have already been ingested, complementing source reduction strategies. See the Sifts Daily Review for complete analysis.
The Organic Food Question
One of the most common questions from health-conscious consumers: does choosing organic produce reduce microplastic exposure?
The answer, based on the available research, is: not significantly for microplastics specifically.
Microplastics enter produce through irrigation water, atmospheric deposition, and soil contamination, all of which affect organic farms similarly to conventional farms. Organic certification prohibits synthetic pesticides and fertilizers but does not restrict plastic mulch use (many organic farms use plastic mulch for weed control), does not guarantee plastic-free irrigation, and does not prevent atmospheric deposition.
Multiple studies that have directly compared microplastic concentrations in organic versus conventional produce have found no consistent significant difference. Organic produce may have lower pesticide residue levels (a different and genuinely meaningful health consideration), but it does not meaningfully reduce microplastic exposure.
This is not an argument against organic produce, it’s a clarification that the organic certification is addressing different concerns than microplastic contamination.
Frequently Asked Questions
How many microplastics do I eat per day?
Current estimates suggest approximately 100 to 250 particles per day from food alone for most adults, though this depends heavily on diet, location, and detection methodology. When drinking water and air are included, the estimate rises substantially. All current estimates undercount nanoplastics due to detection limitations.
Which food has the most microplastics?
Bottled water has the highest particle concentration per liter of any common beverage. Among solid foods, filter-feeding shellfish (mussels, oysters, clams) have the highest concentration per gram. Sea salt has among the highest concentrations of any condiment. Highly processed foods in plastic packaging may have elevated contamination from packaging contact.
Do organic fruits and vegetables have fewer microplastics?
Not meaningfully. Organic certification does not address the primary microplastic contamination routes (irrigation water, atmospheric deposition, soil contamination). Multiple studies have found similar contamination levels in organic and conventional produce.
Does washing produce remove microplastics?
Thorough washing removes surface-deposited particles. Particles that have been absorbed into plant tissue (which some research suggests is possible for certain plants and particle types) cannot be removed by washing. Washing is beneficial but not a complete solution.
Is canned food safer than fresh food from a microplastic perspective?
Canned food trades the plastic packaging-leaching concern for the potential BPA or epoxy resin lining concern. Neither is ideal. Fresh food in minimal packaging (loose produce, items in paper bags) is generally lower contamination than both canned and plastic-packaged food.
Is sea salt really that bad for microplastics?
Yes, sea salt is consistently among the most contaminated common food condiments. Studies have found concentrations ranging from a few particles to over 1,600 particles per kilogram depending on source. Himalayan pink salt and rock salt are substantially less contaminated and are direct substitutes at similar prices.
Does cooking food reduce microplastics?
There is no evidence that normal cooking processes (boiling, baking, frying) significantly reduce microplastic particle counts in food. High temperatures may degrade some polymer types, but they can also release particles from cooking equipment (non-stick pans, plastic utensils) into food.
Are children exposed to more microplastics than adults?
Yes, proportionally. Children eat more food relative to body weight and have more hand-to-mouth behavior. Formula-fed infants are particularly exposed through polypropylene baby bottles, which release large numbers of particles when boiling water is added and the bottle is shaken. Using glass bottles dramatically reduces this.
Does freezing food reduce microplastics?
No. Freezing does not affect the polymer structure of microplastic particles or their contamination of food. Frozen food in plastic packaging may actually have prolonged plastic contact time compared to fresh food.
Is there a test to check my microplastic ingestion level?
There is no routine clinical test for food-borne microplastic ingestion levels. Blood testing (available through specialized environmental medicine labs) can measure systemic particle burden but does not specifically measure food ingestion. It reflects total body burden from all routes.

